Research project · Live tool
Auckland Property Scout
A research project that turns public Auckland listing data into value ranges you can check. I built it to show the evidence behind an estimate and make the method public.
A research project by Yuqian Zhang · refreshed daily · not financial advice
Suburbs
—
Active listings
—
Snapshot date
—
Model
—
The project
What this is, and why I built it
I teach and research in accounting and finance. This began with a personal question: what are the houses in my part of Auckland worth, and how would I know?
The tools I could buy gave me a number, not the reasoning. So I collected the data myself: active listings, council valuations, nearby sales and the price guidance on listing pages. I treated it as a research sample: build a model, test it on data it has not seen, correct for multiple tests, and report what failed.
Some of it worked. The calibrated model is about 6% away from Homes' own estimate on held-out cases, and the 80% interval covered about 80% of them. Text analysis was mixed: listing language helped when the council valuation was missing, but no topic survived correction. It remains a research signal, not a valuation input.
Snapshot
Four numbers, and where they come from
Every figure is read from snapshot.json at load time. If the file cannot be read, the dashes stay and the status line says so.
Method
How a value range is built
01
Recover the price signal
Asking price, guide, deadline or auction date, read from the listing page and dated.
02
Value the tenure
Tenure is checked before a value is produced, because leasehold and cross-lease homes are not directly comparable with freehold.
03
Compare nearby sales
Sold prices weighted by distance and recency, scaled by council capital value where one is available.
04
Calibrate a fallback
A calibrated fallback model for listings with no AVM or usable comparables, with an 80% interval and published error.
The Research Lab shows the model card, coverage and the full results, including the parts that did not work. Each listing also shows tenure with a source, approximate build year and previous sales when Homes.co.nz has a match. School-zone coverage, recent price or description changes and sale history appear as small context flags. For a simple explanation of the data, equations and limits, read the methodology or download the PDF.
The tool
Explore the evidence
The full app runs in your browser from a static data pack: every active listing, filters, the comparable sales behind a property, and the research lab. No account.
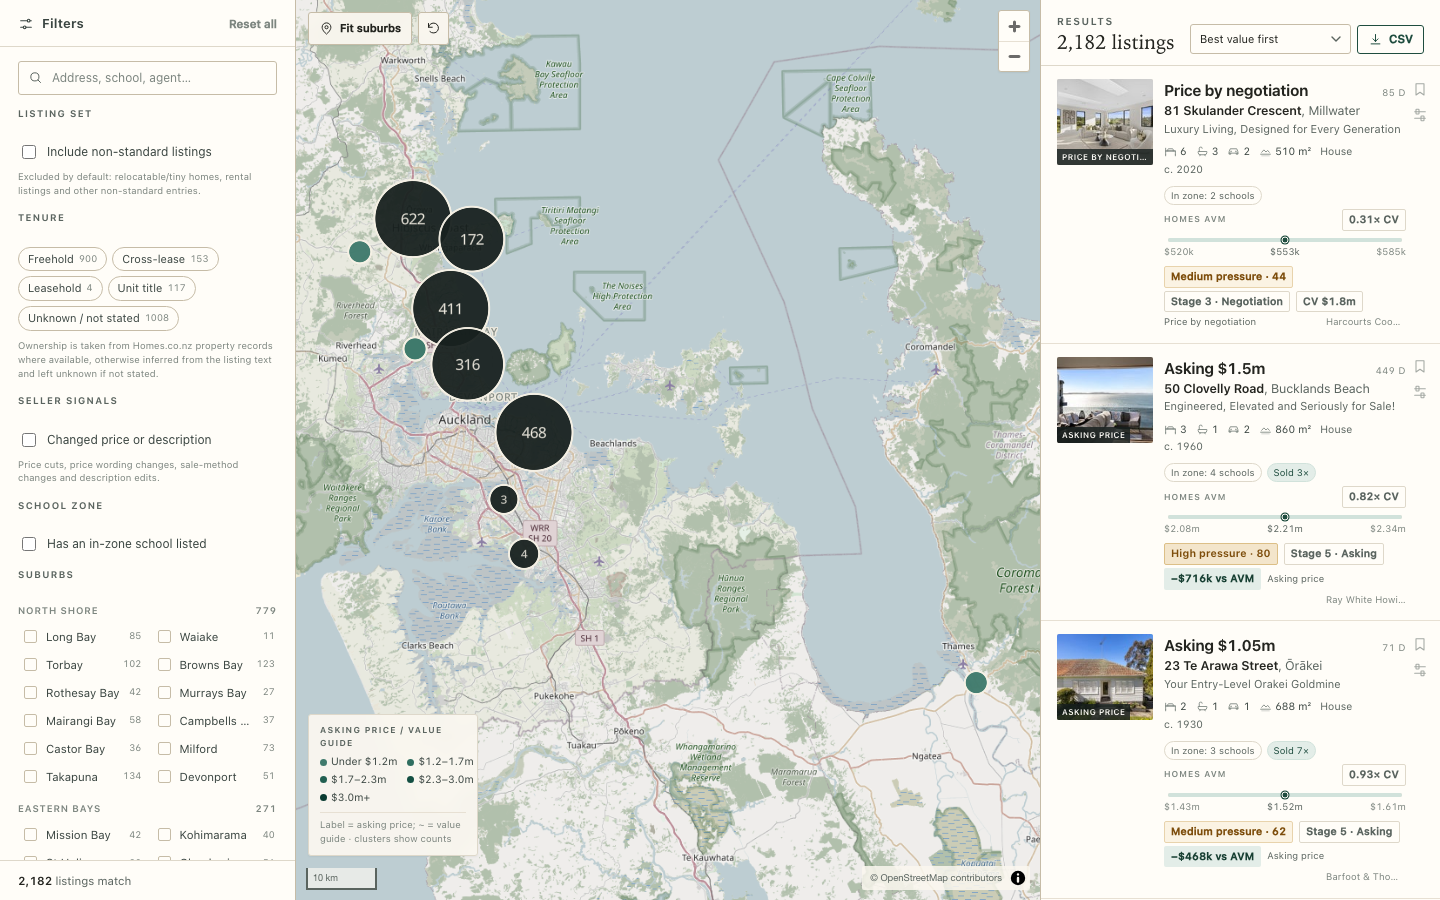 Loading the interactive map…
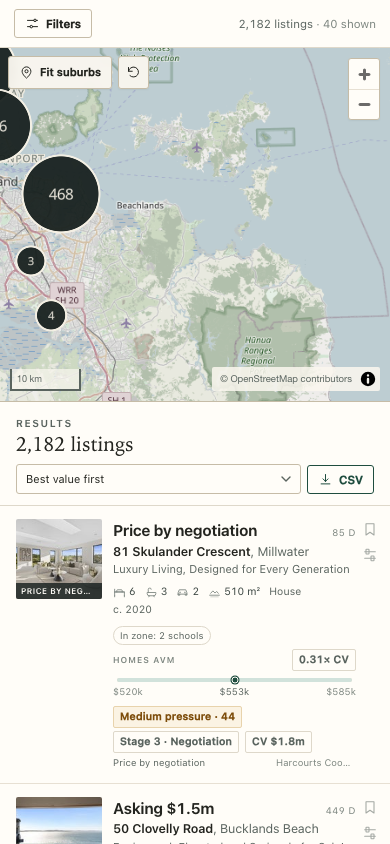
Embedded view. On a phone the map opens in the full app instead.
Open full screen ↗
Research Lab
Methodology
Limits
What it does not do
- Not a valuation. These are estimates for research, not a registered valuation, title search or financial advice.
- Not Auckland-wide. 30 Auckland suburbs across the North Shore, Eastern Bays, Eastern Beaches, Hibiscus Coast and Whangaparāoa Peninsula. Active listings only.
- Not sale prices. Model error is measured against the Homes.co.nz estimate, not settled prices. Where the AVM stops, a comparable-sales or calibrated-fallback route takes over and is labelled.
- Attributed, not owned. Listing data stays attributed to Trade Me and Homes.co.nz; photographs remain with their owners.
The full method, model card and research results are in the Research Lab. Data snapshot: JSON.